Model comparison
In this notebook we compare PEC corrections calculated with different ol-melt Fe-Mg Kd models. These codes can be use to quickly identify how different models change PEC correction results.
import the relevant packages
[2]:
import MagmaPEC as mpc
import MagmaPandas as mp

import pandas as pd
import matplotlib.pyplot as plt
import geoplot as gp

# this is needed to clean up printed results during looped calculations
from IPython.display import clear_output
load data and set up FeOi according to the FeOi and PEC correction examples.
[3]:
melt_file = "./data/melt.csv"
olivine_file = "./data/olivine.csv"
pressure_file ="./data/pressure.csv"
wholerock_file = "./data/wholerock.csv"

melt = mp.read_melt(melt_file, index_col=["name"], units="wt. %")
olivine = mp.read_olivine(olivine_file, index_col=["name"], units="wt. %")
pressure = pd.read_csv(pressure_file, index_col = ["name"]).squeeze()
wholerock = mp.read_melt(wholerock_file, index_col=["name"])
[4]:
x = wholerock.drop(columns=["FeO"])
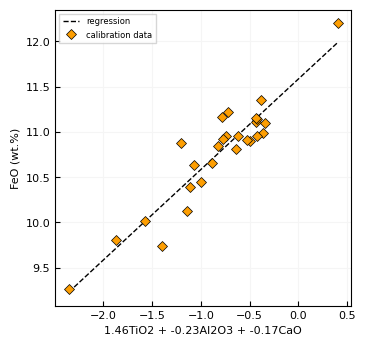
FeOi_predict = mpc.FeOi_prediction(x=x, FeO=wholerock["FeO"])
do_not_use = ["MnO", "P2O5", "Cr2O3", "total"]
model_fits = FeOi_predict.calculate_model_fits(exclude=do_not_use)
FeOi_predict.select_predictors(idx=3)
FeO_model = FeOi_predict.model
Here are all the Kd models we’re going to test. You can also do this for Fe3Fe2 or melt thermometers instead with mpc.Fe3Fe2_models or mpc.melt_thermometers.
[5]:
Kd_models = mpc.Kd_ol_FeMg_models
Kd_models
[5]:
['blundy2020',
 'fixed',
 'putirka2016_8a',
 'putirka2016_8b',
 'putirka2016_8c',
 'putirka2016_8d',
 'saper2022',
 'sun2020',
 'toplis2005']
Now we calculate PEC corrections iteratively for each Kd model.
For a fixed Kd we also need to define the value and its error and pass them as a list to the configuration
Crystallization extents are stored in the pec_results dataframe and corrected melt compositions in the corrected_inclusions dictionary. This dictionary uses Kd model names as keys and stores compositions in dataframes.
[6]:
pec_results = pd.DataFrame(index=melt.index, dtype=float)
corrected_inclusions = {}

Kd_value = 0.35
Kd_error = 0.02

for i, model in enumerate(Kd_models):

    # add Kd value and error if the model is 'fixed'
    set_model = model if model != "fixed" else (model, Kd_value, Kd_error)
    # set the Kd model
    mpc.model_configuration.Kd_model = set_model

    clear_output()
    print(f"model: {model}\n{i+1:03}/{len(Kd_models):03}")

    pec_model = mpc.PEC(inclusions=melt, olivines=olivine, P_bar=pressure, FeO_target=FeO_model)
    melts_corrected, pec, checks = pec_model.correct()

    pec_results[set_model] = pec["total_crystallisation"]
    corrected_inclusions[set_model] = melts_corrected.copy()
model: toplis2005
009/009
Equilibrating ... |██████████████████████████████| 100% [10/10] in 3.6s
Correcting    ... |██████████████████████████████| 100% [10/10] in 13.0s
These are the crystallization extents calculated with the different models
[7]:
pec_results
[7]:
| blundy2020 | (fixed, 0.35, 0.02) | putirka2016_8a | putirka2016_8b | putirka2016_8c | putirka2016_8d | saper2022 | sun2020 | toplis2005 | |
|---|---|---|---|---|---|---|---|---|---|
| name | |||||||||
| PI032-04-01 | 9.669983 | 12.221924 | 10.917725 | 10.917725 | 10.910095 | 10.841650 | 6.590302 | 12.917725 | 9.796851 |
| PI032-04-02 | 10.807312 | 13.931787 | 12.135925 | 12.056689 | 12.250586 | 12.050586 | 7.784198 | 14.326660 | 10.807312 |
| PI041-02-02 | 1.159460 | 2.836523 | 1.929163 | 1.754883 | 1.927637 | 1.756409 | -1.006763 | 2.918481 | -0.005502 |
| PI041-03-01 | 14.807861 | 17.614844 | 16.084595 | 15.304321 | 15.492114 | 14.007861 | 11.345508 | 19.764160 | 12.645239 |
| PI041-03-03 | 14.341699 | 17.221924 | 15.762085 | 14.461047 | 15.250366 | 13.350854 | 11.000000 | 19.539307 | 12.131775 |
| PI041-05-04 | -2.556934 | -0.966846 | -1.805542 | -2.505273 | -2.147778 | -2.496118 | -4.984302 | -1.109082 | -4.403699 |
| PI041-05-06 | 3.488623 | 5.703125 | 4.443066 | 3.703882 | 4.091675 | 3.344861 | 0.800000 | 5.579199 | 1.994775 |
| PI041-07-01 | 13.533203 | 16.312500 | 14.638818 | 13.720996 | 14.251025 | 12.945410 | 9.790521 | 17.044922 | 12.212329 |
| PI041-07-02 | 12.960449 | 15.674243 | 14.072168 | 13.151294 | 13.681323 | 12.419739 | 9.193353 | 17.053857 | 11.118481 |
| PI052-01-02 | -7.058838 | -5.447388 | -6.301343 | -6.634424 | -6.479980 | -6.276929 | -9.327405 | -5.450439 | -8.164673 |
And here are two examples of the associated corrected melt compositions
[8]:
corrected_inclusions["blundy2020"]
[8]:
| SiO2 | Al2O3 | MgO | CaO | FeO | Na2O | K2O | MnO | TiO2 | P2O5 | Cr2O3 | CO2 | H2O | F | S | Cl | total | |
|---|---|---|---|---|---|---|---|---|---|---|---|---|---|---|---|---|---|
| name | |||||||||||||||||
| PI032-04-01 | 48.943719 | 14.013614 | 7.630094 | 9.705938 | 10.314919 | 3.602243 | 0.672540 | 0.138315 | 2.456433 | 0.279344 | 0.000000 | 0.605778 | 1.388135 | 0.076006 | 0.140193 | 0.032730 | 100.0 |
| PI032-04-02 | 48.479654 | 14.629497 | 7.547376 | 9.386726 | 10.340466 | 3.449630 | 0.910037 | 0.140879 | 2.567158 | 0.325500 | 0.000000 | 0.650701 | 1.288021 | 0.081179 | 0.160070 | 0.043106 | 100.0 |
| PI041-02-02 | 49.035956 | 16.830785 | 5.174158 | 9.123172 | 10.257030 | 3.761868 | 1.070182 | 0.157860 | 2.784544 | 0.557070 | 0.000000 | 0.460645 | 0.650866 | 0.047317 | 0.067540 | 0.021008 | 100.0 |
| PI041-03-01 | 45.805062 | 15.410386 | 7.866142 | 10.765738 | 10.734843 | 3.273348 | 1.119837 | 0.117426 | 3.084403 | 0.539931 | 0.000000 | 0.780285 | 0.286932 | 0.077762 | 0.084965 | 0.052940 | 100.0 |
| PI041-03-03 | 45.225725 | 15.624567 | 7.725401 | 10.983367 | 10.806821 | 3.356069 | 1.146547 | 0.094428 | 3.203774 | 0.508575 | 0.000000 | 0.806345 | 0.305534 | 0.080243 | 0.078065 | 0.054541 | 100.0 |
| PI041-05-04 | 47.739154 | 18.499127 | 4.168579 | 9.356278 | 9.387706 | 4.577251 | 1.598948 | 0.142979 | 2.474740 | 0.821254 | 0.000000 | 0.507617 | 0.459434 | 0.087337 | 0.120858 | 0.058737 | 100.0 |
| PI041-05-06 | 46.350575 | 16.864911 | 5.158561 | 8.871758 | 11.454093 | 3.976689 | 1.407932 | 0.173516 | 3.611212 | 0.615599 | 0.000000 | 0.636053 | 0.582065 | 0.106742 | 0.127315 | 0.062978 | 100.0 |
| PI041-07-01 | 45.738018 | 15.077100 | 7.642742 | 9.589114 | 11.633964 | 3.098567 | 1.259341 | 0.150583 | 3.496301 | 0.549176 | 0.000000 | 0.462927 | 1.010345 | 0.074330 | 0.161746 | 0.055747 | 100.0 |
| PI041-07-02 | 45.806314 | 15.375532 | 7.401513 | 9.952743 | 11.490914 | 3.149061 | 1.342889 | 0.139523 | 3.489543 | 0.608231 | 0.000000 | 0.367453 | 0.608398 | 0.072640 | 0.138611 | 0.056636 | 100.0 |
| PI052-01-02 | 49.177883 | 16.933432 | 4.257739 | 10.328566 | 8.486900 | 4.901528 | 1.524944 | 0.240910 | 1.754921 | 0.681335 | 0.047285 | 0.286681 | 1.116948 | 0.081782 | 0.125735 | 0.053411 | 100.0 |
[9]:
corrected_inclusions["saper2022"]
[9]:
| SiO2 | Al2O3 | MgO | CaO | FeO | Na2O | K2O | MnO | TiO2 | P2O5 | Cr2O3 | CO2 | H2O | F | S | Cl | total | |
|---|---|---|---|---|---|---|---|---|---|---|---|---|---|---|---|---|---|
| name | |||||||||||||||||
| PI032-04-01 | 49.206233 | 14.365838 | 6.636341 | 9.940199 | 10.233057 | 3.692838 | 0.689454 | 0.132211 | 2.518211 | 0.286370 | 0.000000 | 0.621013 | 1.423046 | 0.077918 | 0.143719 | 0.033553 | 100.0 |
| PI032-04-02 | 48.691045 | 14.986061 | 6.571461 | 9.606162 | 10.303377 | 3.533640 | 0.932200 | 0.135733 | 2.629678 | 0.333427 | 0.000000 | 0.666547 | 1.319389 | 0.083156 | 0.163968 | 0.044156 | 100.0 |
| PI041-02-02 | 49.228087 | 17.112982 | 4.413466 | 9.268368 | 10.248313 | 3.825082 | 1.088165 | 0.149435 | 2.831335 | 0.566431 | 0.000000 | 0.468385 | 0.661803 | 0.048112 | 0.068675 | 0.021361 | 100.0 |
| PI041-03-01 | 45.991137 | 15.828645 | 6.792065 | 11.047336 | 10.675971 | 3.362487 | 1.150332 | 0.111175 | 3.168397 | 0.554635 | 0.000000 | 0.801534 | 0.294746 | 0.079879 | 0.087279 | 0.054382 | 100.0 |
| PI041-03-03 | 45.388617 | 16.031367 | 6.639883 | 11.258630 | 10.804800 | 3.443792 | 1.176516 | 0.087660 | 3.287515 | 0.521868 | 0.000000 | 0.827421 | 0.313520 | 0.082340 | 0.080105 | 0.055966 | 100.0 |
| PI041-05-04 | 47.880455 | 18.844295 | 3.375884 | 9.522744 | 9.336220 | 4.662865 | 1.628855 | 0.133975 | 2.521028 | 0.836615 | 0.000000 | 0.517112 | 0.468028 | 0.088971 | 0.123118 | 0.059836 | 100.0 |
| PI041-05-06 | 46.481016 | 17.212464 | 4.258297 | 9.046185 | 11.480980 | 4.059090 | 1.437106 | 0.163918 | 3.686041 | 0.628355 | 0.000000 | 0.649232 | 0.594126 | 0.108954 | 0.129953 | 0.064283 | 100.0 |
| PI041-07-01 | 45.867609 | 15.532570 | 6.515228 | 9.866277 | 11.598683 | 3.192366 | 1.297463 | 0.143335 | 3.602140 | 0.565800 | 0.000000 | 0.476941 | 1.040930 | 0.076580 | 0.166642 | 0.057435 | 100.0 |
| PI041-07-02 | 45.927100 | 15.826762 | 6.307860 | 10.232779 | 11.449861 | 3.241603 | 1.382352 | 0.133202 | 3.592089 | 0.626105 | 0.000000 | 0.378252 | 0.626277 | 0.074774 | 0.142684 | 0.058300 | 100.0 |
| PI052-01-02 | 49.345297 | 17.251422 | 3.447559 | 10.522525 | 8.426774 | 4.993573 | 1.553581 | 0.233274 | 1.787877 | 0.694130 | 0.048173 | 0.292065 | 1.137923 | 0.083317 | 0.128096 | 0.054414 | 100.0 |
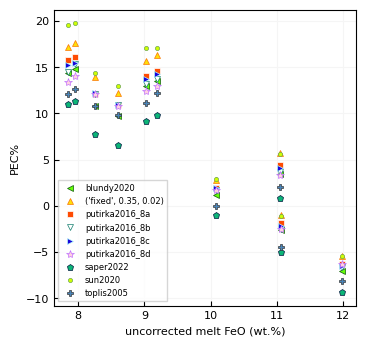
Here we plot PEC results against uncorrected melt FeO contents. It shows that using the Sun et al. (2020) Kd model results in the largest PEC corrections, and the Saper et al. (2022) model the smallest. PEC differences between models for single inclusions are up to ca. 9%.
[17]:
mm = 1/25.4
gp.layout(colors=gp.colors.bright)


fig, ax = plt.subplots(figsize=(90*mm, 85*mm))

for model, pec in pec_results.items():

    ax.plot(melt.loc[pec.index, "FeO"], pec, lw=0., label=model)


ax.legend(frameon=True, fancybox=False)
ax.set_xlabel("uncorrected melt FeO (wt.%)")
ax.set_ylabel("PEC%")

plt.show()
[ ]: